





Cost Analysis and Return on Investment for Commercial Seedling Tray Selection
2026-07-24 17:13:21
Introduction
The seed tray is one of the lowest-cost inputs in commercial seedling production, yet the decisions made about tray specification, quality, and procurement strategy have outsized effects on production outcomes and overall operation profitability. A procurement framework based solely on unit price comparison leads predictably to suboptimal tray selection that costs more in the long run through reduced reuse cycles, higher culling rates, and poor crop outcomes.
A comprehensive cost analysis and return on investment framework for seedling tray selection accounts for all of the cost components affected by the tray decision—not just the purchase price. Using this framework to evaluate tray options transforms a commodity purchasing decision into a value-creation opportunity that improves production efficiency and profitability.
Beyond Unit Price: Understanding the Total Cost of Tray Ownership
Total cost of ownership for seedling trays encompasses all costs incurred from tray procurement through end-of-life disposal or recycling. Direct costs include the purchase price, freight and delivery charges, import duties where applicable, and the cost of incoming inspection and quality verification. Indirect costs—often larger than direct costs but less visible in the purchasing decision—include inventory carrying costs, cleaning and sterilization costs per cycle, culling and rejection costs attributable to tray-related crop defects, labor costs for handling and tray management, and the cost of production disruptions caused by tray quality failures. A buyer who evaluates trays purely on unit price typically achieves the lowest purchase price but often pays more in indirect costs than the apparent savings justify. The operations team managing tray-related crop quality issues, the maintenance staff handling premature tray failures, and the financial team managing the inventory costs of excessive buffer stock all experience costs that are invisible to the person making the procurement decision based on unit price. Calculating the total cost of ownership requires operational data that many operations do not track systematically: culling rates by tray format, tray failure rates across reuse cycles, labor hours for tray handling and cleaning, and inventory levels and carrying costs by tray type. Building this data tracking into the operational management system provides the foundation for evidence-based tray procurement.
Reuse Cycle Analysis: How Quality Affects Service Life
The number of reuse cycles a tray achieves before replacement is a primary driver of per-plant tray cost, and it varies dramatically with tray quality. A premium quality tray from a well-engineered manufacturer using UV-stabilized polypropylene copolymer with appropriate wall thickness and structural ribbing can achieve 10 to 15 production cycles before replacement. An economy tray using a lower-grade polymer and minimal wall thickness may fail after 2 to 3 cycles, making its per-plant cost many times higher than the unit price comparison suggested. The reuse cycle calculation must account for the cleaning and sterilization costs incurred between each cycle. Trays that accumulate surface damage, biofilm, and micro-cracking during use become progressively harder and more expensive to clean effectively. The point at which a tray becomes uneconomical to reuse is reached when the cleaning cost per cycle exceeds the amortized cost of replacement with a new tray, which varies by operation based on labor cost and cleaning method. Field performance data from a manufacturer's customer base is the most reliable basis for estimating reuse cycle potential. Operations that share their field performance data with their tray suppliers contribute to a knowledge base that benefits the entire customer community, and a manufacturer that collects and analyzes this data can provide more accurate reuse cycle estimates to new and existing customers.
The Culling Rate Connection: Tray Quality and Crop Rejection Costs
Culling rate—the percentage of seedlings removed from a production batch due to quality defects—is influenced by tray quality through multiple pathways. Trays with inconsistent cell geometry produce germination variation that translates directly to culling rate. Trays with drainage defects create zones of waterlogging that cause uneven growth and increase disease pressure. Trays that flex excessively during handling cause medium spillage and root damage that adds to culling counts. The culling rate impact of tray quality differences is often overlooked in the procurement decision because it is attributed to seed quality, growing medium, or irrigation management rather than to the tray itself. A controlled comparison—running identical seed lots and growing conditions in trays from two different manufacturers or quality grades—can isolate the tray-related contribution to culling rate and quantify the financial impact of tray quality differences. For a commercial operation producing 5 million transplants per year, a 1 percent reduction in culling rate attributable to better tray selection represents 50,000 additional saleable plants per year at the average selling price per transplant. This revenue impact dwarfs the unit price difference between premium and economy tray grades.
Labor Efficiency Differences Across Tray Formats and Qualities
Labor costs associated with tray handling are directly affected by tray format and quality. Trays that flex excessively under load are harder to carry without spillage and require more careful stacking to prevent collapse. Trays with inconsistent external dimensions cannot be stacked in stable columns and create jams and slowdowns in automated handling systems. Trays with damaged cells or flash artifacts impede the seed dispensing process and increase the per-cell labor time in manual seeding operations. Tray cleaning labor varies significantly with tray quality. High-quality trays with smooth, non-porous surfaces and consistent cell geometry clean faster and more completely than economy trays with rough surfaces, inconsistent wall angles, and surface defects that trap organic residues. The difference in cleaning time per tray, multiplied by the number of trays processed per year and the labor cost per hour, can represent thousands of dollars annually. A manufacturer can often provide guidance on the labor efficiency characteristics of their tray designs based on feedback from commercial customers using time-motion studies, helping buyers evaluate the labor cost implications of different tray specifications before committing to a purchase.
Building a Quantified Procurement Framework for Tray Selection
The quantified procurement framework begins with defining the performance specifications that matter most for the specific operation: minimum reuse cycle count, maximum culling rate attributable to tray quality, required dimensional tolerances for automation compatibility, and any regulatory requirements such as organic certification compliance. These specifications define the minimum acceptable tray quality level. Within trays that meet the minimum specifications, the total cost of ownership comparison across reuse cycles determines the best value rather than unit price. This calculation amortizes all direct and indirect costs across the expected reuse cycle count to arrive at a per-plant tray cost that can be compared fairly across options. The lowest total cost of ownership option is the rational choice regardless of its unit price. Supplier performance on delivery reliability, quality consistency, and responsiveness to issues should factor into the decision alongside the pure cost analysis. A supplier that delivers trays 3 days late in spring—the worst possible timing—imposes costs that are not captured in any unit price comparison but can be financially devastating to the operation.
Conclusion
Commercial growers who understand the full scope of factors affecting their seedling tray performance—and who work with suppliers and manufacturers that provide genuine technical depth rather than just catalog products—consistently achieve better production outcomes than those who treat tray selection as a commodity decision. The investment of time and attention in understanding tray science and matching specifications to operational requirements pays compounding returns across every production cycle and every market season.
Australian Institute of Horticulture. (2023). Nursery Production Standards and Guidelines. Australian Horticulture.
Oregon State University Extension Service. (2023). Greenhouse Technology and Nursery Automation. OSU Extension.

The CNC Seed Braiding Machine is a high-precision, fully automated agricultural equipment s...
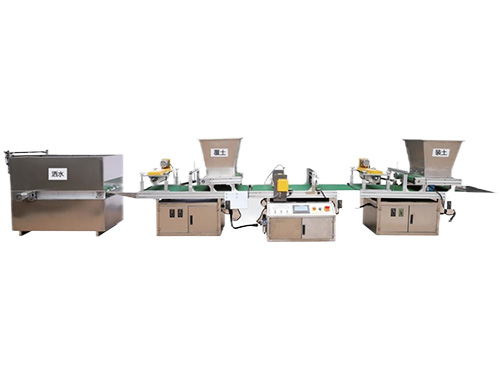
It adopts electrical integration and can be started by pressing the fully automatic button ...
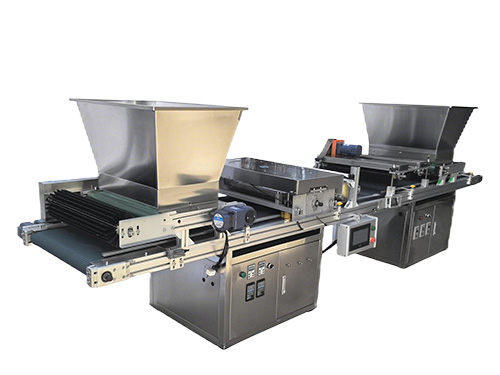
The XP750 seeder has stable performance, excellent product quality, simple and convenient o...
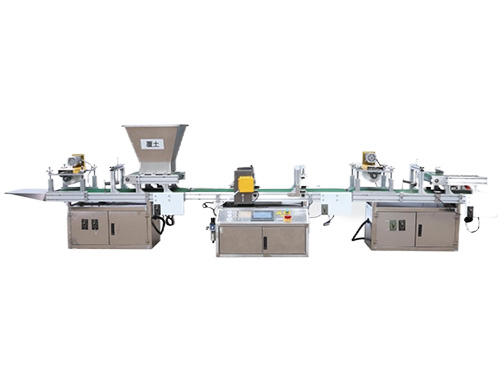
It adopts electrical integration and can be started by pressing the fully automatic button ...